
The trucking industry has been fighting for a crash preventability determination program since the inception of CSA, and for good reason. With their business partners’ continued use of CSA to make safety-based business decisions, it seems unfair to make judgments about carriers’ safety posture based on crashes drivers did not cause nor could have prevented. That’s why, about a year ago, FMCSA announced that its crash preventability pilot program was being expanded and made permanent. FMCSA and the industry touted its success by pointing out that 97% of eligible crashes were ultimately determined not-preventable. Recently released data confirms this, showing that 96.5% of eligible crashes are not-preventable. As always, there’s a little more to this story.
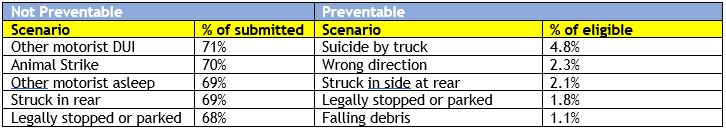
In truth, only about 54% of the crashes submitted to this program are found not preventable, with a whopping 44% ruled not eligible for the program. Since the program began, over 6,000 crashes were submitted that carriers or drivers felt were clearly not preventable but that don’t meet the program eligibility. While it’s understandable that carriers want to fight to have every possible crash removed, a closer look at the data will point carriers toward those more likely to succeed and those which face the greatest chance of being deemed preventable, which is a carrier’s worst nightmare. The chart below highlights successes and failures of carriers in the preventability program and can be used as a tool to help carriers better scrutinize their submissions. The data always tells a story. It’s up to us to listen.