
As we draft this newsletter in mid-July, the Commercial Vehicle Safety Alliance (CVSA) is launching its annual Operation Safe Driver Week. During this annual one-week period, law enforcement personnel throughout the U.S. identify, pull over, and issue warnings or citations to CMV and passenger vehicle drivers engaging in unsafe driving behaviors such as speeding, distracted driving, unsafe or improper lane changes, and the like. Law enforcement also tries to prevent these behaviors through driver education events throughout the week. CVSA deserves a great deal of credit for this annual enforcement and education initiative.
We’ve all heard the statistic that’s the focus of CVSA’s initiative–driver error (i.e., unsafe driving behaviors along with driving mistakes) typically causes about 90% of serious vehicle crashes each year (cars and trucks). That means that less than 10 percent of annual serious vehicle crashes are caused by vehicle-related problems or violations.
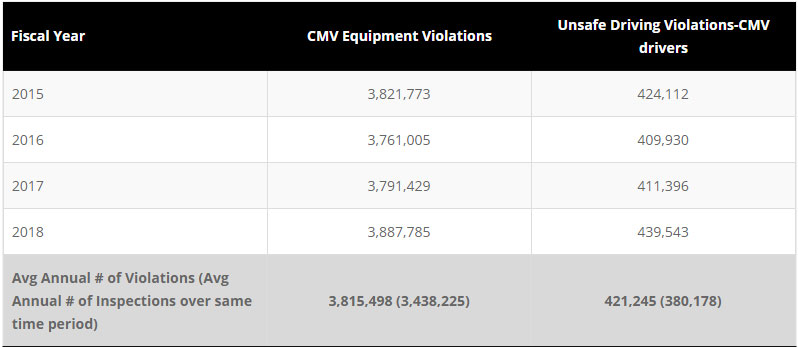
CVSA’s Operation Safe Driver week made us at STC wonder how many total unsafe driving violations by CMV drivers are discovered each year by CVSA enforcement personnel compared to how many total vehicle-related violations are discovered by CVSA CMV inspectors each year. Below are the numbers and averages for FYs 2015-2018, the most recent data available from FMCSA. Some quick math tells us that CMV equipment violations are found and documented by CVSA inspections more than nine times as often as unsafe CMV driving violations. We end this piece with a question for readers to ponder. Given well-known crash causation data, and these violation numbers, do you think we are allocating our annual CMV safety law enforcement resources to get the biggest bang for our safety buck?